Management reports
Key performance indicators are important for company’s management. They evaluate the success of an organization in different parameters. This following manual introduces KPI’s and shows how to find and use management reports in ERPLY Books.
1.1 Budget Creator
The process of creating a budget looks like this:
First, type “Budget creator” into dash board search box. The result looks like this:
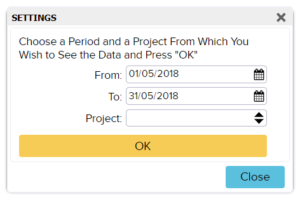
As you can see, you can select the date range (preferably at the beginning and at the end of the month), and project (optional).
Let’s review an example, if you want to add a full year profit and loss budget comparison.
- First, you need to enter the balances for all the months.
- While inserting the balances, keep in mind the following conditions:
- The period should start with January;
- All the balances have to be cumulative. The revenues and expenses of February has to include the balance of January, not only contain sales made in February. For example: If the expected sales in January is 10,000 EUR, and in February 8000 EUR, then the expected balance of February is 18000 EUR);
- If you only want a cost-revenue comparison, you can leave balance accounts empty.
1.2 Compare Budget to Account Balances
Budget comparison with reality
In order to view the comparison of budget and reality, use the search module on the main page and search for “Compare Budget to Account Balances” and press ENTER.
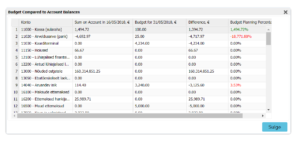
Then, the program asks for the date range and the project. For example, if you want to compare the balances of February, mark the date as the end of February. The result looks like this:
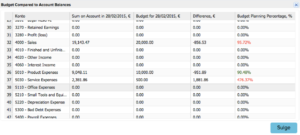
As we can see, we assumed that our revenues in February are going to be 20 000. In reality, we have collected 19 143.47, that is 856.53 less than we had planned which means we achieved 95,72% of the goal we projected. Since we have not achieved the objective of revenue, it is written in red.
The cost side, as we can see, the product expenses are also in deficit. But it is a good thing – the cost has been reduced – therefore the result is written in green.
In conclusion, the budget comparison shows the summary of deficit/surplus and what is the percentage of fulfilling the goal.
1.3 Key Performance Indicators by Quarter
Insert “Key Performance Indicators by Quarter” to the search box and press ENTER.
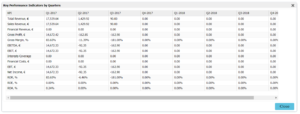
“Key performance indicators by quarter” module allows you to compare the KPI (total revenue, sales revenue, gross profit, gross margin EBIT etc.) figures of two different financial years on a quarterly basis.
1.4 Key Performance Indicators by Year
Insert “Key Performance Indicators by Year” to the search box and press ENTER.
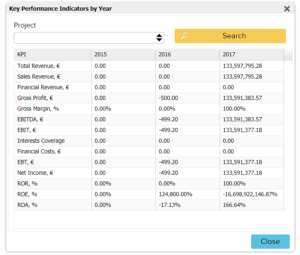
“Key performance indicators by year” module allows you to compare the KPI (total revenue, sales revenue, gross profit, gross margin EBIT etc.) figures over the years years.
1.5 Key Performance Indicators for the Last 12 Months
Insert “Key Performance Indicators for the last 12 Month” to the search box and press ENTER.
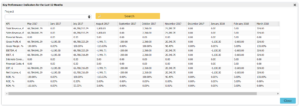
“Key Performance Indicators for the last 12 Month” module allows you to compare last 12 month KPI (total revenue, sales revenue, gross profit, gross margin EBIT etc.) figures with previous and following ones.
1.6 Show Altman Z-Score
Insert “Show Altman Z-Score” to the search box and press ENTER.
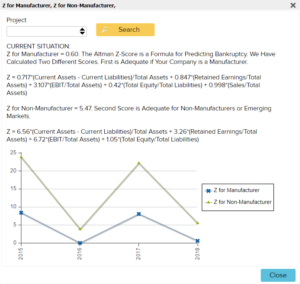
This graph shows the Altman Z-Score that is a formula for predicting bankruptcy. Here two different scores have been calculated – score is adequate for companies as manufacturers (the first blue line), and secondly, score is adequate for non-manufacturers or emerging markets (green line).
1.7 Show Average Collection Period
Insert “Show Average Collection Period” to the search box and press ENTER.
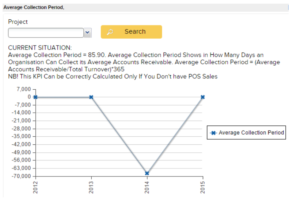
This is a graph for average collection period that shows in how many days an organisation can collect its average accounts receivables. The average collection period equals (Average Accounts Receivable/Total Turnover)*365.
1.8 Show Basket Value for the Last 3 Weeks
Insert “Show Basket Value for the Last 3 Weeks” to the search box and press ENTER.
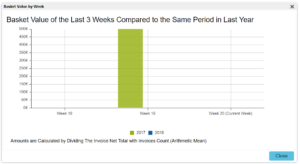
Basket value equals sumNoVat (i.e. the average amount of the sales invoice).
1.9 Show Cash Ratio
Insert “Show Cash Ratio” to the search box and press ENTER.
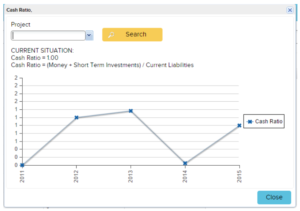
Current situation:
Cash Ratio = 1,0 ; Cash Ratio = (Money+Short Term Investments)/Current Liabilities
Current ratio shows the percentage of how much current debt (open receivables, received prepayments etc) can be paid at the end of given year. The higher the value, the better is financial situation.
1.10 Show Cost of Goods Sold Value
Insert “Show Cost of Goods Sold Value” to the search box and press ENTER.
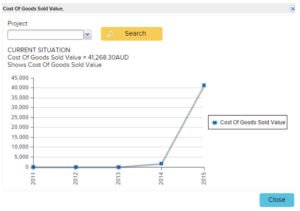
“Show Cost of Goods Sold Value” refer to the carrying value of goods sold during a particular period. Costs include all costs of purchase, costs of conversion and other costs incurred in bringing the inventories to their present location and condition.
1.11 Show Current Ratio
Insert “Show Current Ratio” to the search box and press ENTER.
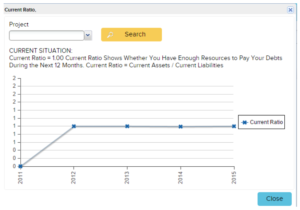
The current ratio is a liquidity ratio measuring a company’s ability to pay short-term and long-term obligations, also known as the working cash flow ratio. It shows whether you have enough resources to pay your debts during the next 12 months. Your Current Assets should count at least for 1.5 times of Current Liabilities to be considered healthy.
1.12 Show Debt Ratio
Insert “Show Debt Ratio” to the search box and press ENTER.
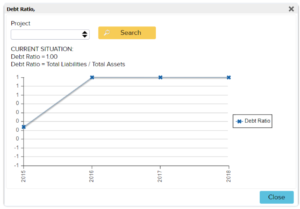
Debt Ratio = Total Liabilites / Total Assets
Debt Ratio is a financial ratio that indicates the percentage of a company’s assets that are provided via debt. It is the ratio of total debt (the sum of current liabilities and long-term liabilities) and total assets (the sum of current assets and fixed assets).
If the ratio is higher than or equal to one, it is considered “unhealthy”, meaning that organisation’s total debt is bigger than its assets. If debt ratio is, for example, 0.5 then it means that 1€ of debt is covered by 0.5€ of total assets.
1.13 Show Debt-To-Equity Ratio
Insert “Show Debt-To-Equity Ratio” to the search box and press ENTER.
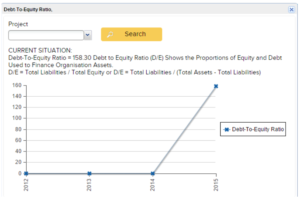
Debt-to-Equity Ratio shows the proportions of Equity and Debt used to finance organisation assets. It means that Debt to Equity = Total Liabilities / Total Equity or
Debt to Equity = Total Liabilities / (Total Assets – Total Liabilities). If Debt to Equity is bigger than 1, assets are financed more by Liabilities.
1.14 Show EBIT
Insert “Show EBIT” to the search box and press ENTER.
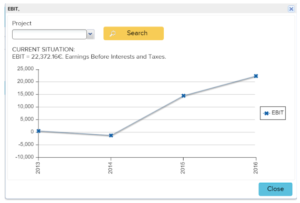
EBIT shows Earnings Before Interests and Taxes.
1.15 Show EBITDA
Insert “EBITDA” to the search box and press ENTER.
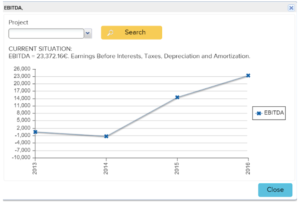
EBITDA shows earnings before interests, taxes, depreciation and amortization.
1.16 Show EBT
Insert “EBT” to the search box and press ENTER.
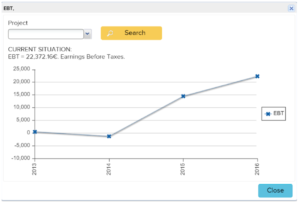
EBT shows Earnings Before Taxes.
1.17 Show Financial Expenses
Insert “Show Financial Expenses” to the search box and press ENTER.
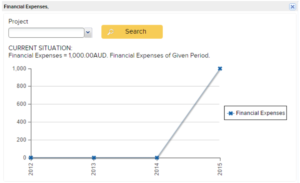
Financial Expenses shows the total value of organisation expenses within a given period.
1.18 Show Financial Revenue
Insert “Financial Revenue” to the search box and press ENTER.
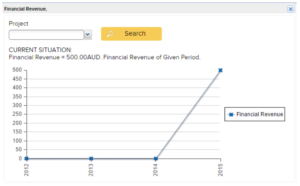
Financial Revenue shows the organisation incomes within a given period.
1.19 Show GMROI
Insert “GMROI” to the search box and press ENTER.
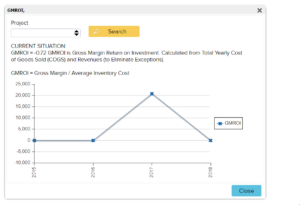
GMROI shows gross margin return on investment.
It is calculated from Total Yearly Cost of Goods Sold (COGS) and Revenues (to Eliminate Exceptions).
GMROI = Gross Margin / Average Inventory Cost
1.20 Show Gross Margin
Insert “Show Gross Margin” to the search box and press ENTER.
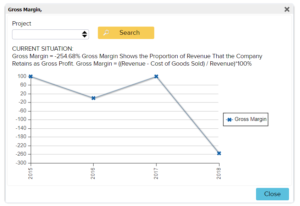
Gross Margins shows the proportion of revenue that the company retains as gross profit. Gross Margin = ((Revenue – Cost of Goods Sold) / Revenue)*100%.
1.21 Show Gross Profit
Insert “Show Gross Profit” to the search box and press ENTER.
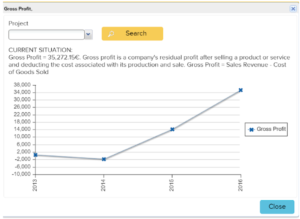
Gross Profit is a company’s residual profit after selling a product or service and deducting the cost associated with its production and sale. Gross Profit = Sales Revenue – Cost of Goods Sold
1.22 Show income, expenses and profit
Insert “Show income, expenses and profit” to the search box and press ENTER.
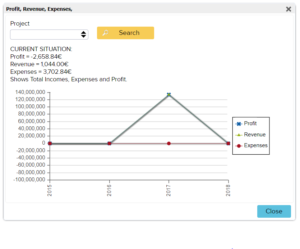
Income, Revenue and Expenses shows total incomes, expenses and profit.
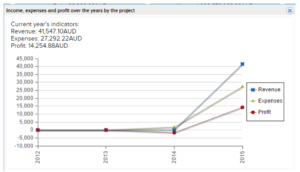
1.23 Show income, expenses and profit over the years by the project
Insert “Show income, expenses and profit over the years by the project” to the search box and press ENTER.
1.24 Show Interests Coverage
Insert “Show Interests Coverage” to the search box and press ENTER.
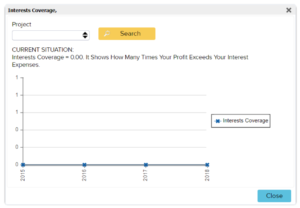
When the amount shows is zero, then it means you don’t have interest expenses on your account.
1.25 Show Inventory Period
Insert “Show Inventory Period” to the search box and press ENTER.
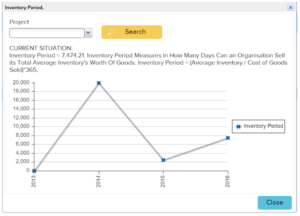
Inventory period measures in how many days can an organisation sell its total average inventory’s worth of goods. Inventory Period = (Average Inventory / Cost of Goods Sold)*365.
1.26 Show Inventory Turnover
Insert “Show Inventory Turnover” to the search box and press ENTER.
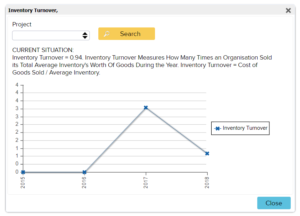
Inventory Turnover measures how many times an organisation sold its total average inventory’s worth of goods during the year. Inventory Turnover = Cost of Goods Sold / Average Inventory.
1.27 Show Last Week’s Sales By Day
Insert “Show Last Week’s Sales By Day” to the search box and press ENTER.
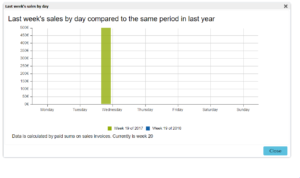
This report shows the last year’s same week sales. Left side bar represents last year sales and right side bar sales from this year.
NB: As the last year dates might not be the same as this year’s last week dates, the last year’s week is calculated.
1.28 Show Net Income
Insert “Net Income” to the search box and press ENTER.
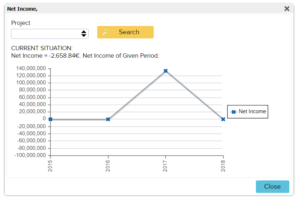
Report shows last four year total profit values in a graph.
1.29 Show Quick Ratio
Insert “Quick Ratio” to the search box and press ENTER.
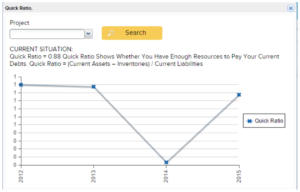
Quick Ratio shows whether you have enough resources to pay your current debts or not. Quick Ratio = (Current Assets – Inventories) / Current Liabilities
If Quick Ratio is bigger than or equal to one, it is considered “Healthy”, meaning that 1€ of current debt is covered by Quick Ratio of Liquid Assets. If Quick Ratio is smaller than 1 it is considered “Unhealthy”, meaning that 1€ of current debt is covered by less than 1€ of Liquid Assets.
1.30 Show Receivables Turnover
Insert “Receivables Turnover” to the search box and press ENTER.
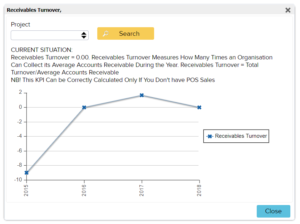
Receivables Turnover measures how many times an organisation can collect its average accounts receivables during the year. Receivables Turnover = Total Turnover/Average Accounts Receivable. NB! This KPI Can be correctly calculated only if you do not have POS Sales
1.31 Show ROE, ROR and ROA
Insert “Show ROE, ROR and ROA” to the search box and press ENTER.
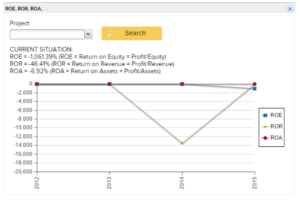
CURRENT SITUATION:
ROE = -1,061.39% (ROE = Return on Equity = Profit/Equity)
ROR = -46.41% (ROR = Return on Revenue = Profit/Revenue)
ROA = -6.92% (ROA = Return on Assets = Profit/Assets)
1.32 Show Sales By Hour
Insert “Show Sales By Hour” to the search box and press ENTER.
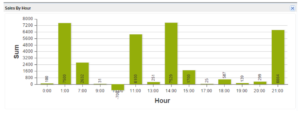
This report shows sales by hour in a graph.
1.33 Show Sales From the Last 3 Weeks
Insert “Show Sales From the last 3 Weeks” to the search box and press ENTER.
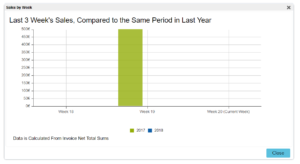
This report shows the last year’s same week sales. Green bars represents last year sales and blue side bars sales from this year within the three weeks (in this example the equivalent weeks are week 29 and 30; as the week 31 represents current week, there are no sales shown there).
1.34 Show Sales Revenue
Insert “Show Sales Revenue” to the search box and press ENTER.
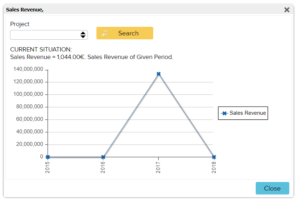
Sales Revenue shows company’s yearly income of given period in a graph.
1.35 Show top 10 customers by debt
Insert “Show top 10 customers by debt” to the search box and press ENTER.
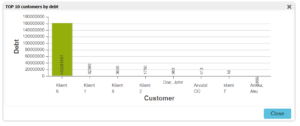
This report shows the customers with highest debts increasingly from right to left, so that the biggest debtors are given in the left column.
1.36 Show top 10 customers by transaction amount
Insert “Show top 10 customers by transaction amount” to the search box and press ENTER.
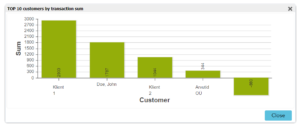
This report shows top 10 customers based on the amount of their transaction sums (increasing from right to left).
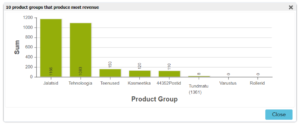
1.37 Show Top 10 Product Groups by Total Sales
Insert “Show top 10 Product Groups by Total Sales” to the search box and press ENTER.
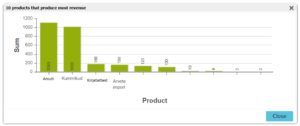
1.38 Show Top 10 Products by Revenue They Produce
Insert “Show Top Products by Revenue They Produce” to the search box and press ENTER.
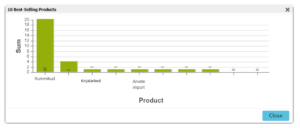
1.39 Show Top 10 Products By Sold Quantity
Insert “Show Top 10 Products by Revenue” to the search box and press ENTER.
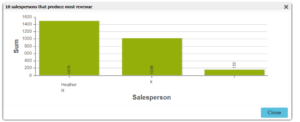
1.40 Show Top 10 Sales Guys by Revenue
Insert “Show Top 10 Sales Guys by Revenue” to the search box and press ENTER.
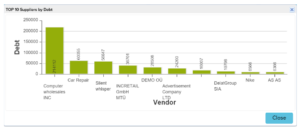
1.41 Show Top 10 Suppliers by Debt
Insert “Show Top 10 Suppliers by Debt” to the search box and press ENTER.
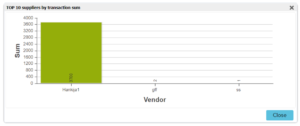
1.42 Show Top 10 Suppliers by Transaction Sum
Insert “Show Top 10 Suppliers by Transaction Sum” to the search box and press ENTER.
1.43 Show Total Current Assets Value
Insert “Show Total Current Assets Value” to the search box and press ENTER.
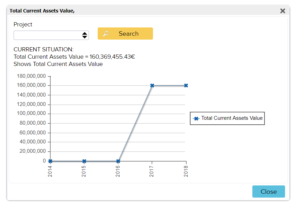
This report shows the total current assets value yearly.
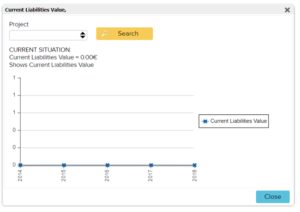
1.44 Show Total Current Liabilities Value
Insert “Show Total Current Liabilities Value” to the search box and press ENTER.
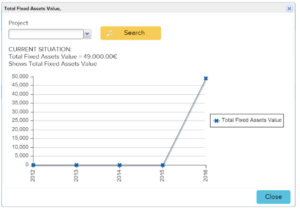
1.45 Show Total Fixed Assets Value
Insert “Show Total Fixed Assets Value” to the search box and press ENTER.
1.46 Show Total Revenue
Insert “Show Total Revenue” to the search box and press ENTER.
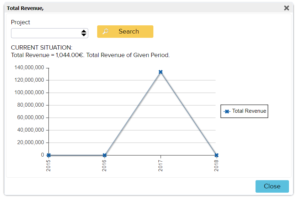
This reports shows the current situation of the total revenue in the given time period.
1.47 Show Total Value of All Liabilities
Insert “Show Total Value of All Liabilities” to the search box and press ENTER.
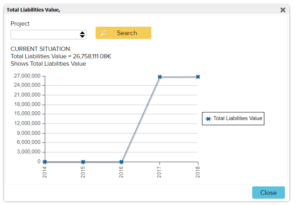
This report shows the current situation of the total liabilities value in the given time period.
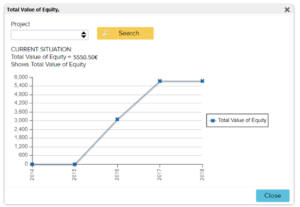
1.48 Show Total Value of Equity
Insert “Show Total Value of Equity” to the search box and press ENTER. This shows the current situation of the total value of equity in the given time period.
1.49 Simple Budget Report
Insert “Simple Budget Report” to the search box and press ENTER. This function shows numerically how much money is needed to reach the budget. “-” in front of the required number means that one has exceeded the budget by the given number.
When you have not achieved the objective of revenue, it is written in red. When the cost has been reduced, the result is written in green.