Analyse projects using Report Generator
NB: most of the following topics require new projects and other report versions. Please contact us at support@erplybooks.com, so we can help you to enable them.
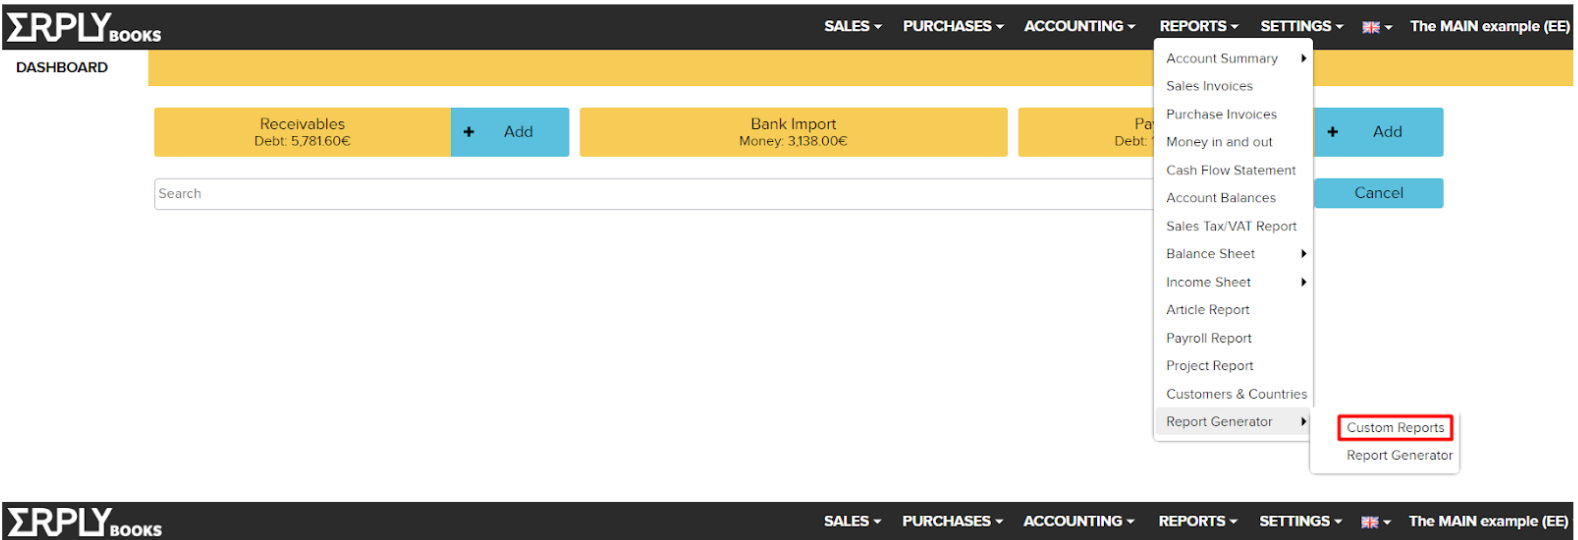
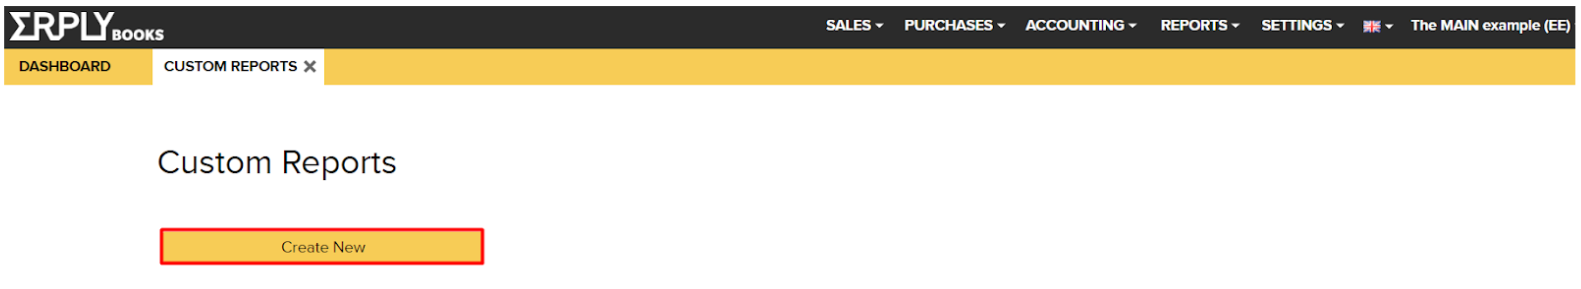
In order to compile a new report according to a specific task, go to “Reports” > “Report Generator” > “Custom reports” > “Create new”. You will be directed to the Report Generator. Here you can create a report according to your needs.
In this manual we are going to show you how to create project reports:
- Expenses in projects
- Sales by country and project
- Sales by customer and project
- Purchases by the supplier and project
- Expenses by account and project
- How to see projects on different charts
Every report can be filtered by project, this gives you, for example, all invoices where project X is, or sales totals by the project.
How to see total expenses in projects
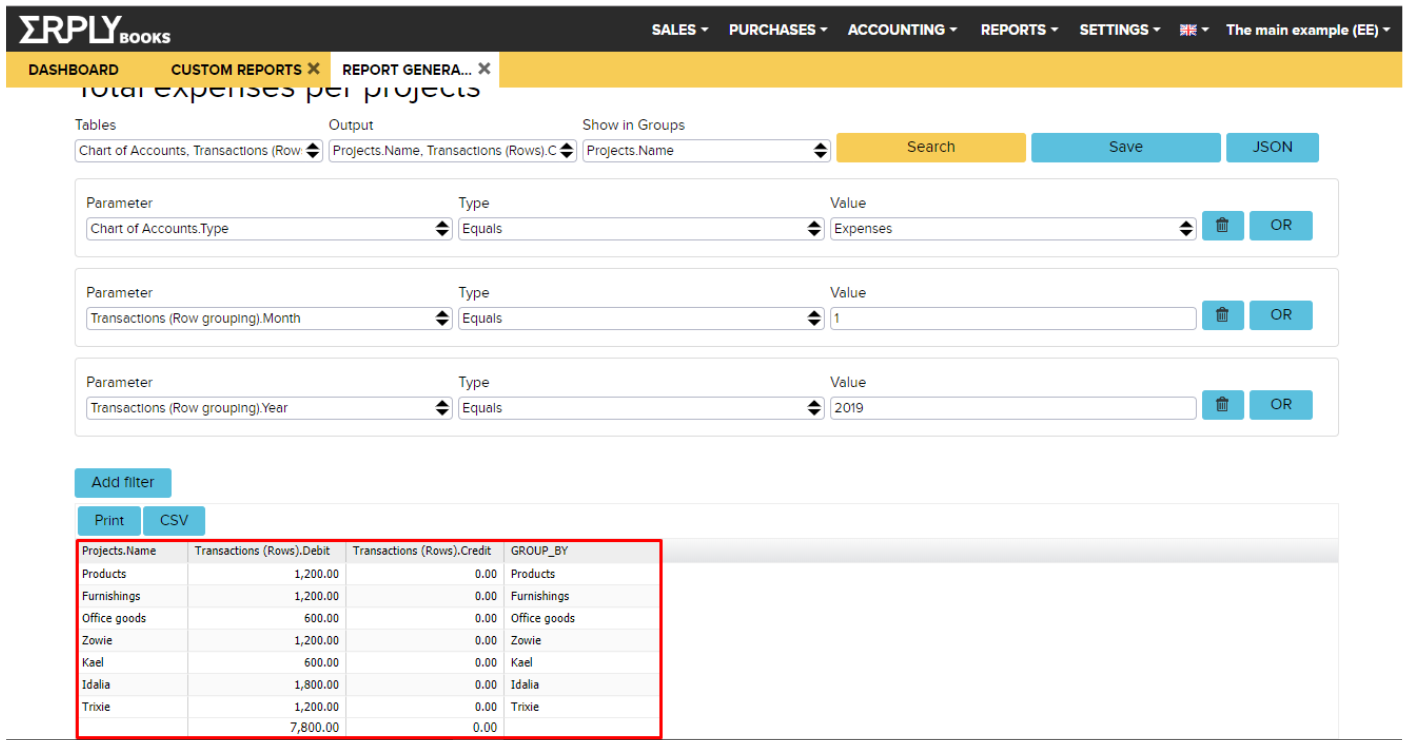
In order to see the total expenses per project, you need to create a custom report with the following instructions:
- Tables
- Chart of Accounts
- Transactions (rows)
- Projects
- Transactions (row grouping)
- Transactions (rows) – Projects
- Output
- Projects.Name
- Transactions (rows).Debit
- Transactions (rows).Credit
- Show in groups – Projects.Name
Click “Add filter”:
- Parameter – Chart of accounts.Type
- Type – Equals
- Value – Expenses
Click “Add filter”:
- Parameter – Transactions (row grouping).Month
- Type – Equals
- Value – Write down the number of the month
Click “Add filter”:
- Parameter – Transactions (row grouping).Year
- Type – Equals
- Value – Write down the years
Click the “Search” button and you will see the total expenses per project. It’s wise to save this report for the future by clicking the “Save” button. This way you’ll have it at your disposal in Custom reports.
How to see sales by country and by project
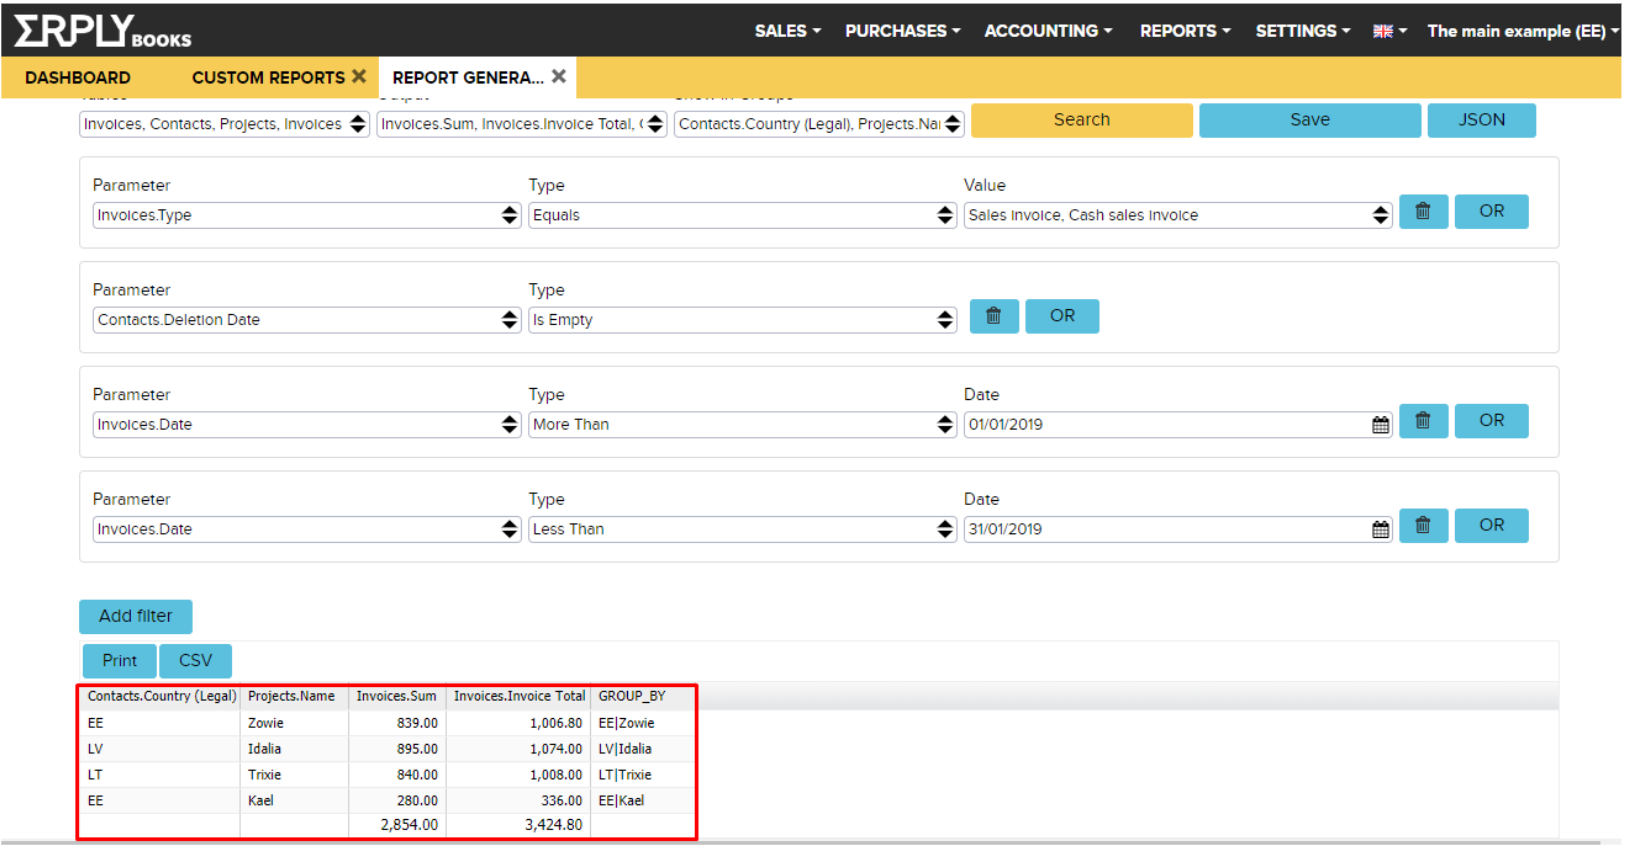
In order to see the sales by country and by project, you need to create a custom report with the following instructions:
- Tables
- Invoices
- Contacts
- Projects
- Invoices – Projects
- Output
- Invoices.Sum
- Invoices.Invoice Total
- Contacts. Country (Legal)
- Projects.Name
- Show in groups
- Contacts.Country (Legal)
- Projects.Name
Click “Add filter”:
- Parameter – Invoices.Type
- Type – Equals
- Value
- Sales invoice
- Cash sales invoice
Click “Add filter”:
- Parameter – Invoices.Deletion Date
- Type – Is Empty
Click “Add filter”:
- Parameter – Invoices.Date
- Type – More Than
- Value – Choose the date
Click “Add filter”:
- Parameter – Invoices.Date
- Type – Less Than
- Value – Choose the date
Click the “Search” button and you will see the total expenses per project. It’s wise to save this report for the future by clicking the “Save” button. This way you’ll have it at your disposal in Custom reports.
How to see sales by customer and by project
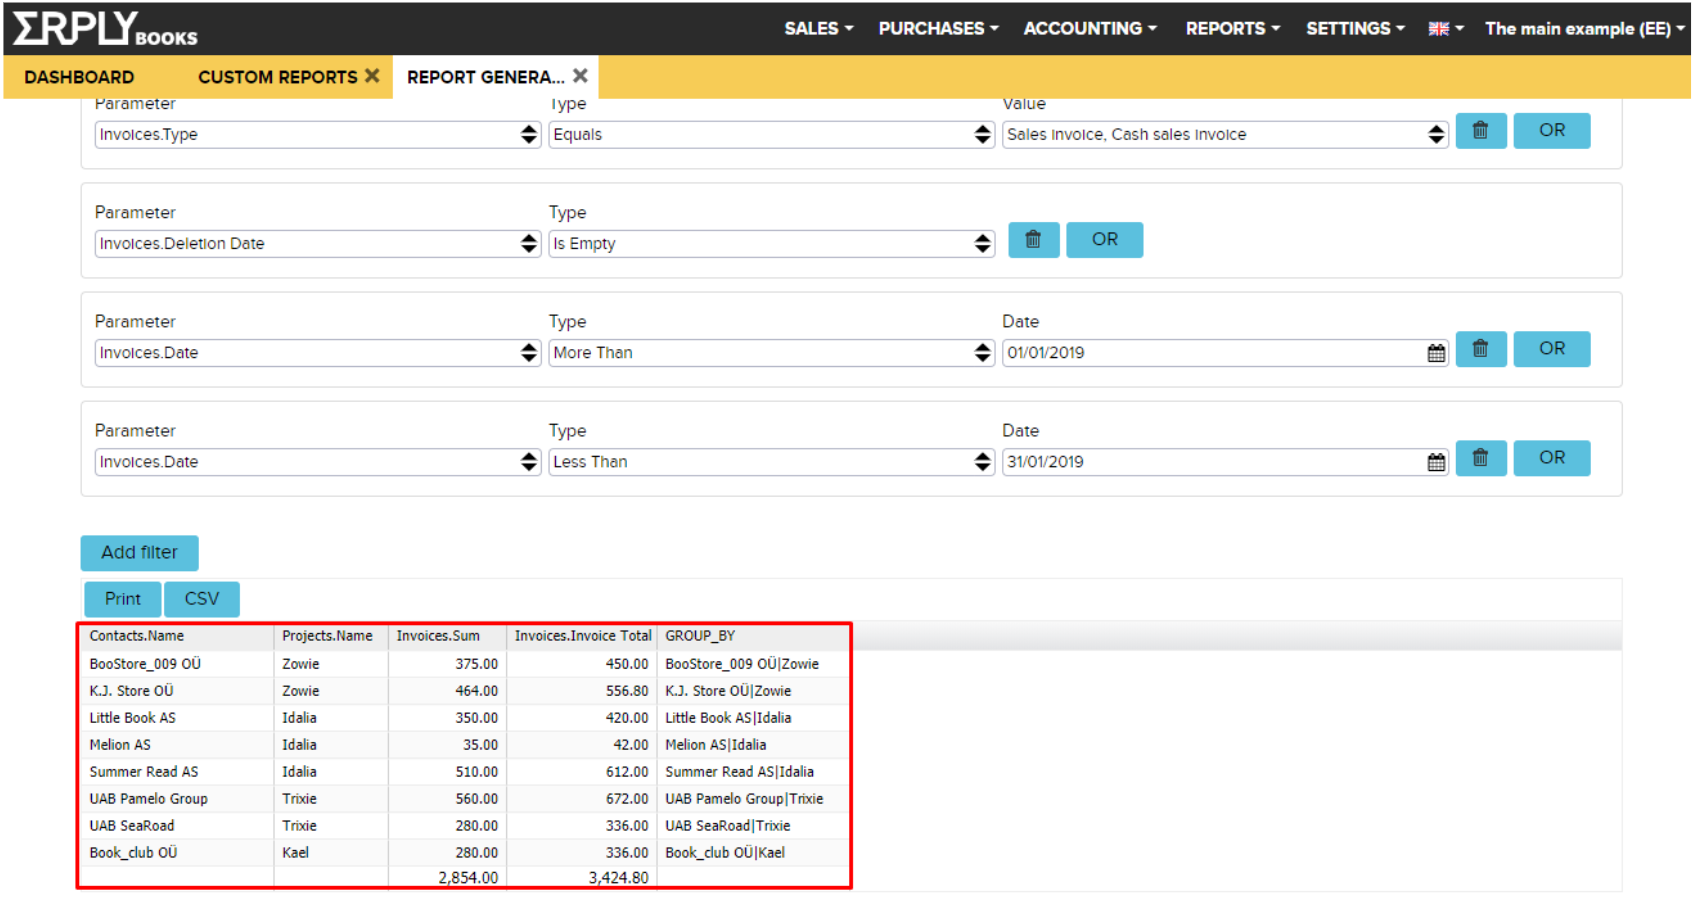
In order to see the sales by customer and project, you need to create a custom report with the following instructions:
- Tables
- Invoices
- Contacts
- Projects
- Invoices – Projects
- Output
- Invoices.Sum
- Invoices.Invoice Total
- Contacts.Name
- Projects.Name
- Show in groups
- Contacts.Name
- Projects.Name
Click “Add filter”:
- Parameter – Invoices.Type
- Type – Equals
- Value
- Sales invoice
- Cash sales invoice
Click “Add filter”:
- Parameter – Invoices.Deletion Date
- Type – Is Empty
Click “Add filter”:
- Parameter – Invoices.Date
- Type – More Than
- Value – Choose the date
Click “Add filter”:
- Parameter – Invoices.Date
- Type – Less Than
- Value – Choose the date
Click the “Search” button and you will see the total expenses per project. It’s wise to save this report for the future by clicking the “Save” button. This way you’ll have it at your disposal in Custom reports.
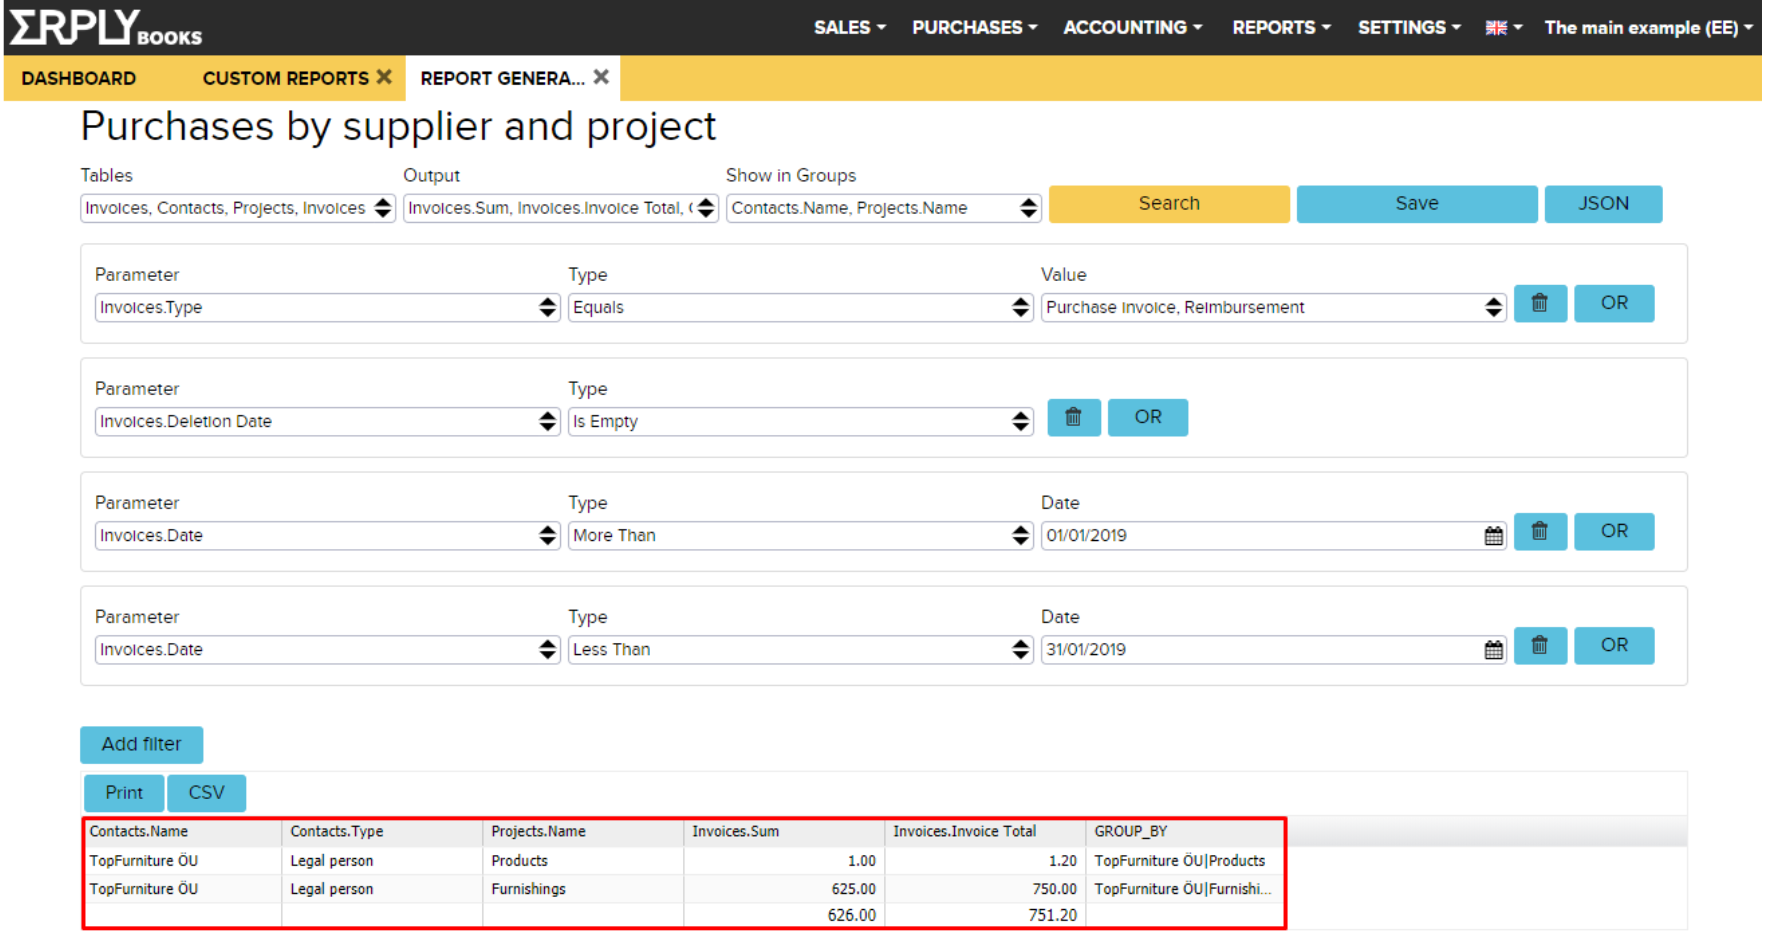
How to see purchases by the supplier and by project
In order to see the purchase by the supplier and by project, you need to create a custom report with the following instructions:
- Tables
- Invoices
- Contacts
- Projects
- Invoices – Projects
- Output
- Invoices.Sum
- Invoices.Invoice Total
- Contacts.Name
- Contact.Type
- Projects.Name
- Show in groups
- Contacts.Name
- Projects.Name
Click “Add filter”:
- Parameter – Invoices.Type
- Type – Equals
- Value
- Purchase invoice
- Reimbursement
Click “Add filter”:
- Parameter – Invoices.Deletion Date
- Type – Is Empty
Click “Add filter”:
- Parameter – Invoices.Date
- Type – More Than
- Value – Choose the date
Click “Add filter”:
- Parameter – Invoices.Date
- Type – Less Than
- Value – Choose the date
Click the “Search” button and you will see the total expenses per project. It’s wise to save this report for the future by clicking the “Save” button. This way you’ll have it at your disposal in Custom reports.
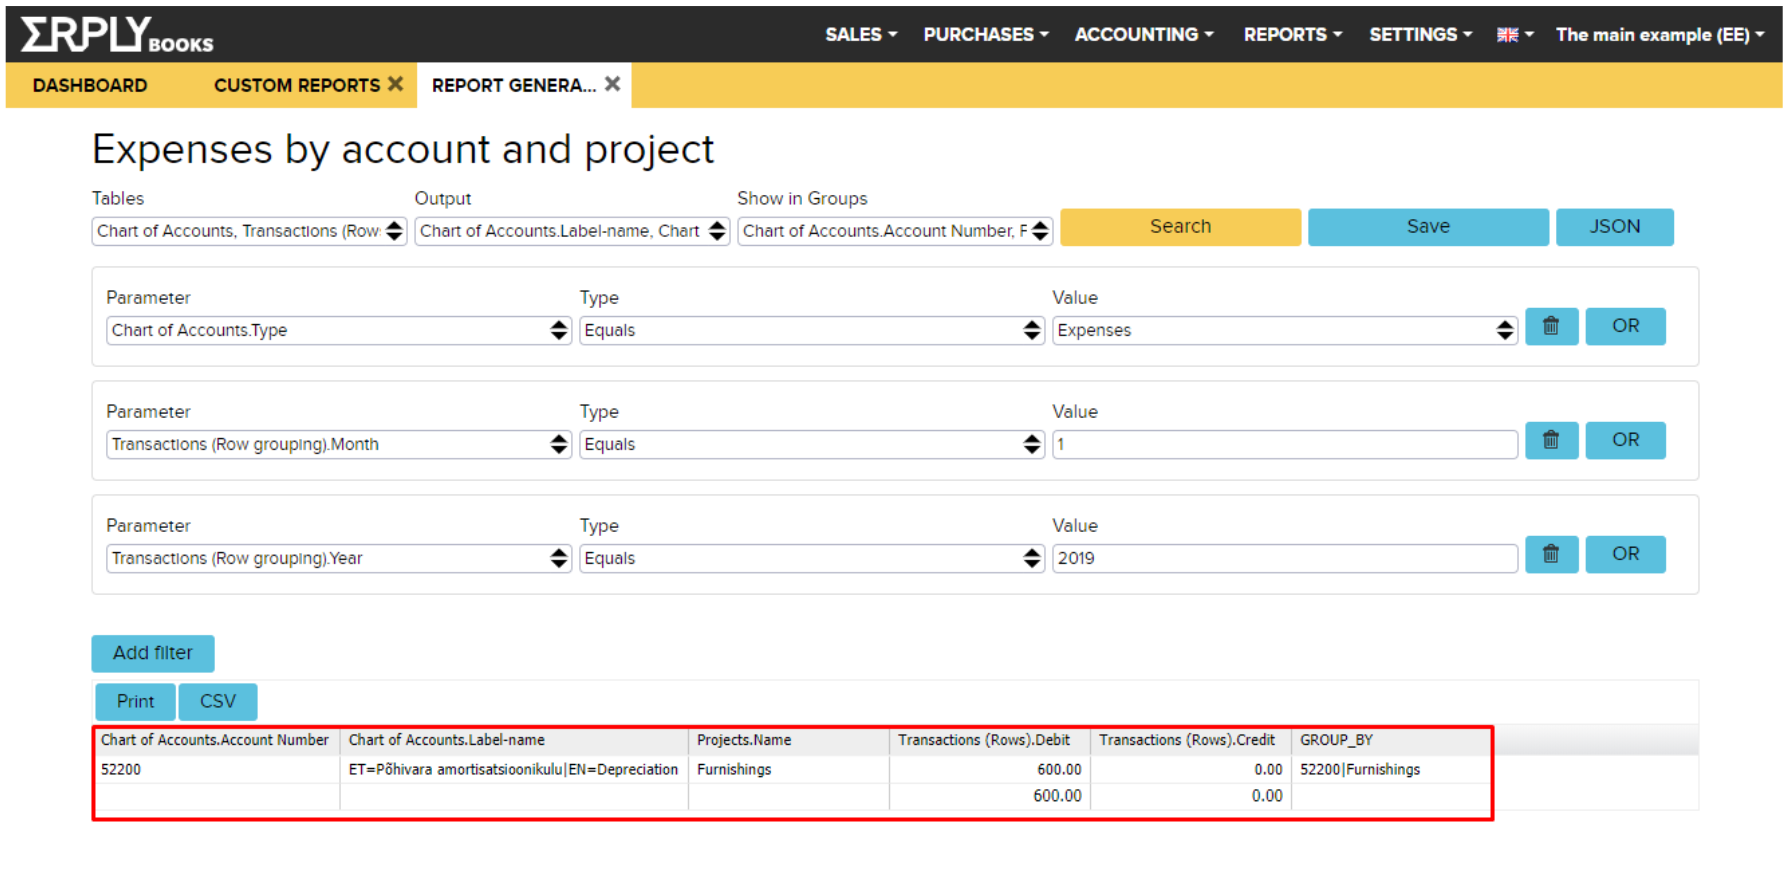
How to see expenses by account and by project
In order to see the expenses by account and by project, you need to create a custom report with the following instructions:
- Tables
- Chart of accounts
- Transactions (rows)
- Projects
- Transactions (row grouping)
- Transactions (rows) – Projects
- Output
- Chart of accounts.Label-name
- Chart of accounts.Account number
- Transactions (row).Debit
- Transactions (row).Credit
- Projects.Name
- Show in groups
- Chart of accounts.Account number
- Projects.Name
Click “Add filter”:
- Parameter – Chart of Accounts.Type
- Type – Equals
- Value – Expenses
Click “Add filter”:
- Parameter – Transactions (Row grouping).Month
- Type – Equals
- Value – Write down the number of the month
Click “Add filter”:
- Parameter – Transactions (row grouping).Year
- Type – Equals
- Value – Write down the years
Click the “Search” button and you will see the total expenses per project. It’s wise to save this report for future by clicking the “Save” button. This way you’ll have it at your disposal in Custom reports.
How to see projects on different charts
In order to see the projects on different charts, first of all, you need to create a custom report for projects.
For example, let’s take a total expense per project. In the Output field, we need to add Transactions (Row grouping).Month because we also need the month value. Also, add this to grouping fields (so you group values by project and month). After searching click “Chart” and you will get settings for the chart:
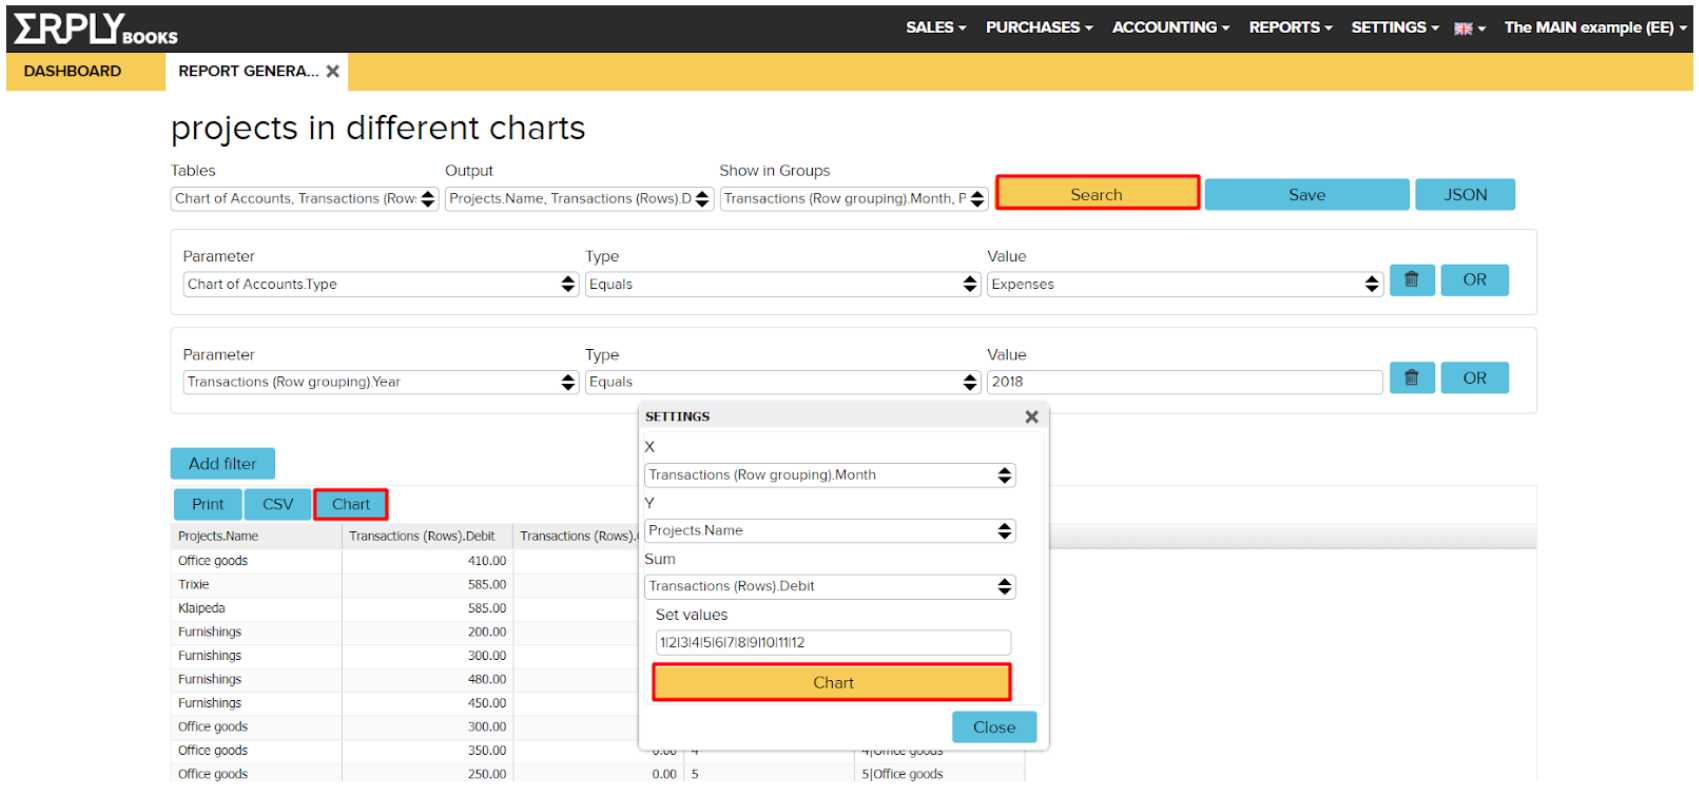
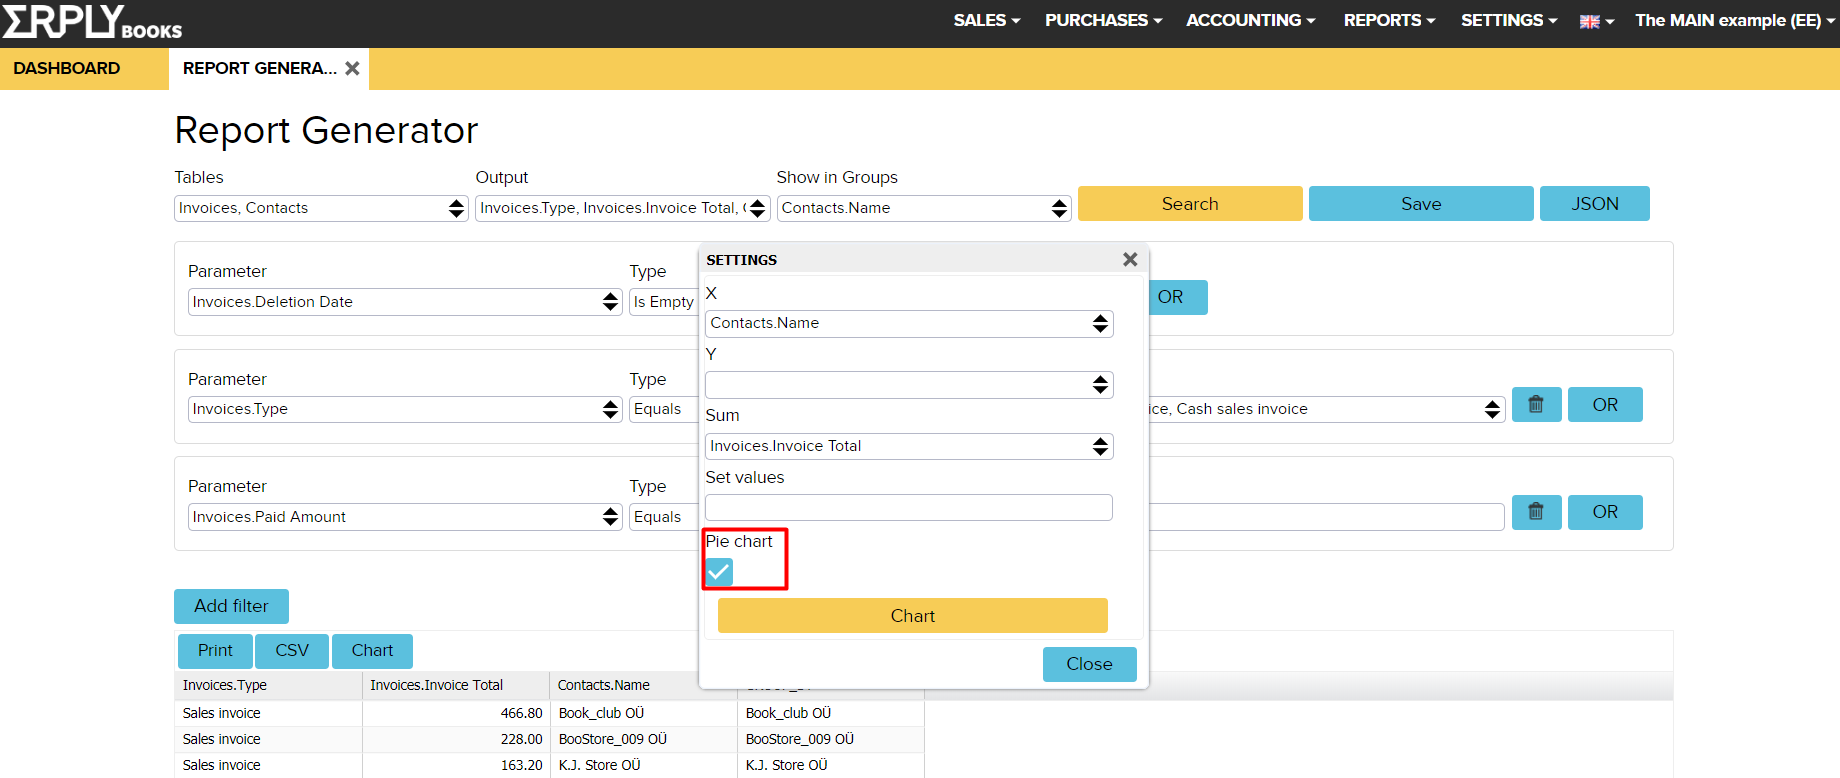
How to fill chart settings:
- X field
X-axis – what do you want to see in X-axis? Meaning if you want to see months horizontally, then X = months. (In our example choose Transactions (Row grouping).Month)
- Y field
Y-axis – not compulsory, it is necessary if you have more than one field that you need to show in the chart. In order to see projects by month, the Y should equal Project. (In this case, we choose Projects.Name)
- Sum field
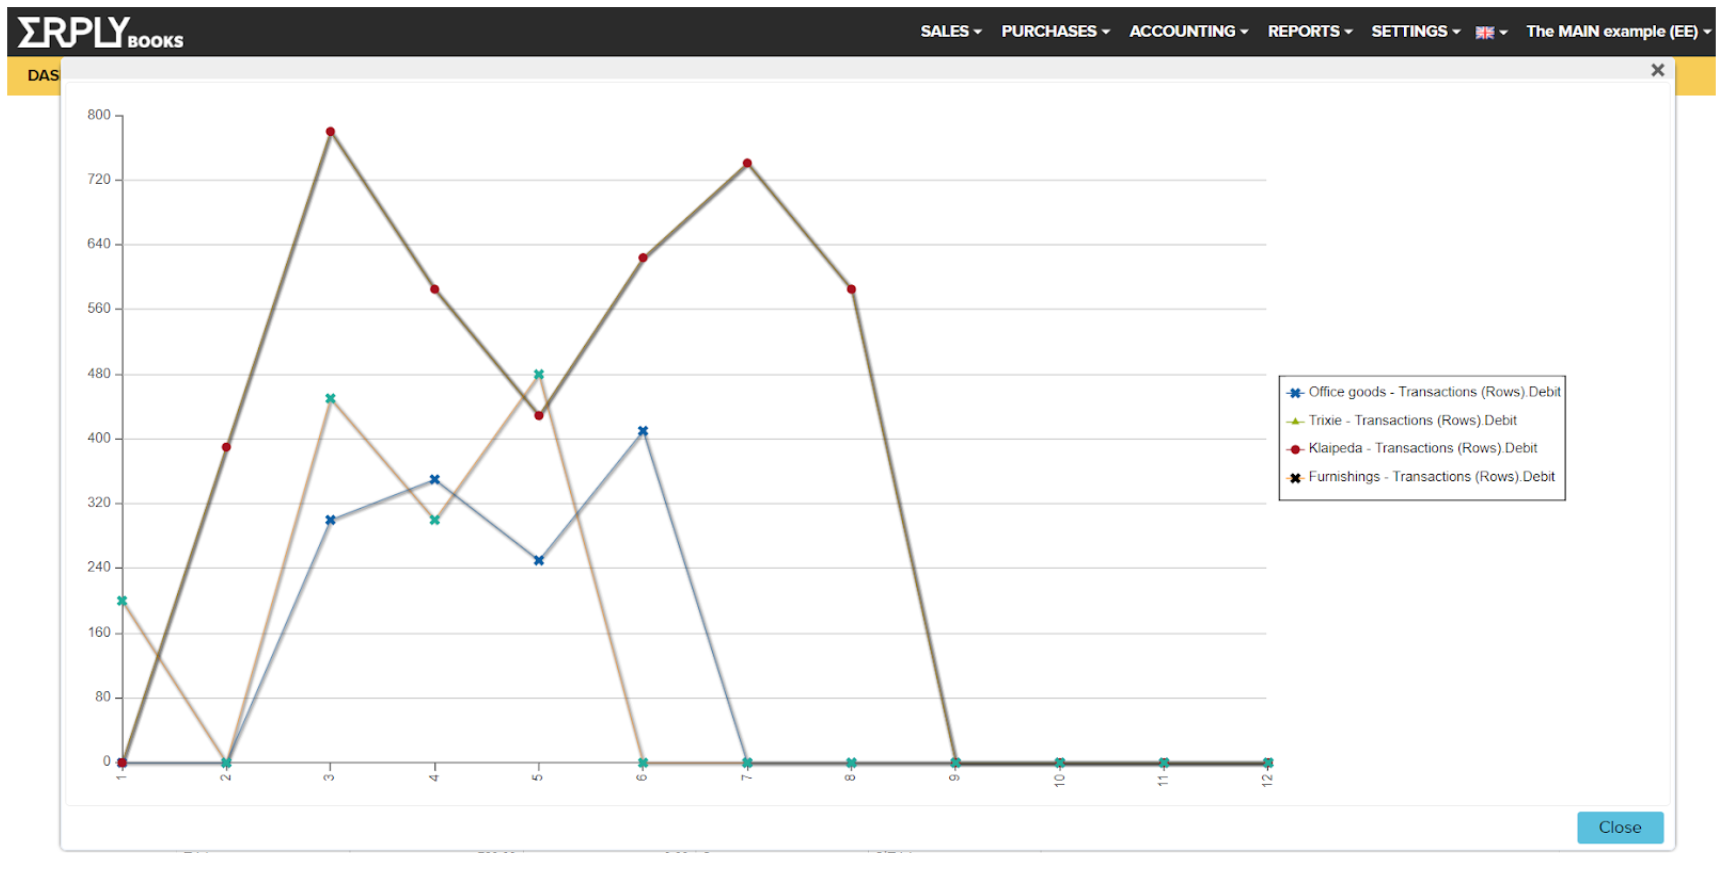
Choose which number(s) you want to see in the chart (if you select more than one, then it also shows them as separate lines). (In this case, we are choosing Transactions (Rows).Debit)
- Set values field
This field is to set X-axis values. It can be left empty, for example, if you have transactions only in January and February, then the system will show you just these months. But if you want to see all moths, then you have to fill it like this: 1|2|3|4|5|6|7|8|9|10|11|12. Important: the numbers have to be separated by the vertical bar.
Click the “Chart” button to see the chart. In the picture below you can see the monthly expenses in projects.