Application of different reports in ERPLY Books
What reports are available and where are they applied?
- Ordinary Income Sheet (Profit & Loss Statement) and Balance sheet (e.g. used for government reporting);
- Detailed Income Sheet (Profit & Loss Statement) and Balance sheet (e.g. used for asking loans from the bank);
- 12 months reports – Income Sheet & Balance Sheet (most commonly used by the company shareholders/management);
- Comparative reports are used to compare multiple time periods (e.g. current and previous financial year; also commonly used by shareholders/management);
- User designed report is developed in case you need a customly formatted internal Balance Sheet or the Income Sheet (e.g. if you need to report to the parent company in a specific format).
The detailed Income Sheet (Profit/Loss Statement)
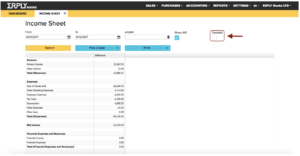
In the detailed Income Sheet (Profit/Loss Statement) all transactions are displayed by account, which improves the navigation. Go to “Reports” > “Income Sheet”. This is how a non-detailed Income Sheet looks:
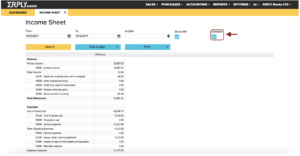
And this is an example of a detailed Income Sheet (Profit/Loss Statement):
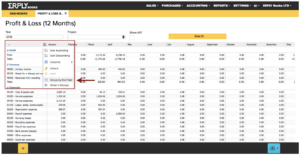
12 months Income Sheet (Profit/Loss Statement)
The Profit & Loss statement for 12 months shows you the bigger picture by the calendar year. It also may show you all your entries or group them in sections. E.g. different expense types (see the screenshots below). To open it, go to “Reports” > “Income Sheet” > “Profit & Loss (12 Months)”.
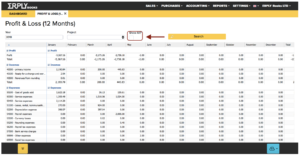
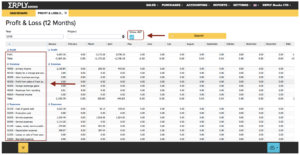
Your Income, Expense & Profit sections may also be sorted in different order. To do this, click in the right-top corner of the section and click “Group by this field”.
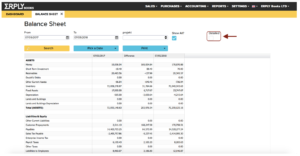
The detailed Balance Sheet
Detailed Balance Sheet also displays transactions by account, for improved navigation. To open it, go to “Reports” > “Balance Sheet”. This is how a non-detailed Balance Sheet looks:
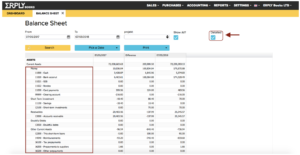
And this is an example of a detailed Balance Sheet:
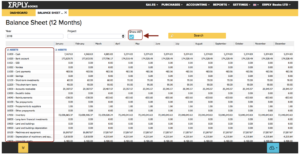
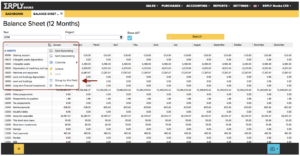
12 months Balance Sheet
The Balance Sheet for 12 months shows you the bigger picture by the calendar year. It also may show you all accounts or group them in sections. E.g. Bank accounts (see the screenshots below). To open it, go to “Reports” > “Balance Sheet” > “Balance Sheet (12 Months)”.
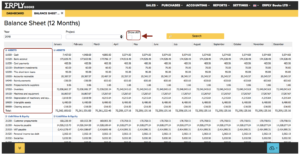
Your Assets, Liabilities & Equity sections may also be sorted in different order.
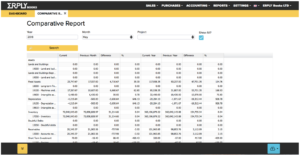
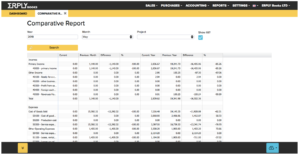
Comparative reports
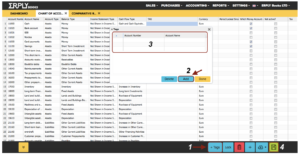
In ERPLY Books comparative reports help you to analyze and compare several financial periods (usually two months, quarters or years). Comparative modes are available for both – Balance and Income Sheets (see the screenshots below). To open it, go to “Reports” > “Balance Sheet” [or “Income Sheet”] > “Comparative Report”.
User designed reports
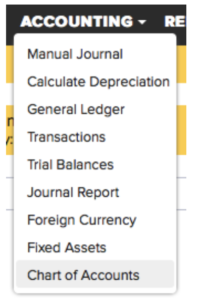
For convenience purposes, ERPLY Books may group your accounts by tags. This comes in handy when you want to group certain accounts for easier reading and navigation. In order to add a tag, go to “Accounting” > “Chart of Accounts” > “+Tags” > “Add”.
Multiple locations/projects:
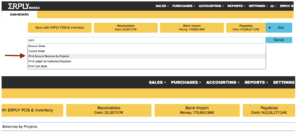
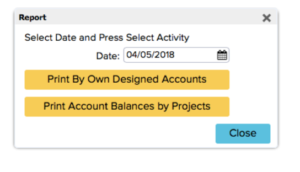
If you have 5 locations (e.g. Maxima Riga, Maxima Daugavpils etc.) and only want to print the report from one location, go to “Dashboard” > type in the search box “Print account balances by projects” > and click “Print by own designed accounts”.
Here we introduce You financial statements as the profit and loss statements and balance sheet in ERPLY Books. Watch this video for further information.